Preliminary observations of construction activity in Australia following COVID-19
A couple months into COVID-19, and patterns are emerging. Contractors are seeing productivity loss but have avoided severe shut down. Planners, designers and engineers are going through forced digital transformation, many with temporarily reduced hours and salaries. The pipeline is contracting in consumer facing sectors but steadied by government-led infrastructure projects. Most people are keenly watching the Federal and State plans for re-opening, and the targets of stimulus packages.
It’s been a noisy six weeks. Early on, I noted anything where COVID and construction met, hoping I could make sense of it later. I now have enough to draw out basic themes, which I’d like to offer up each month. My goal is to contribute to a shared understanding of where the Australian construction market is going. My suggestions for topics include:
April. Early observations of the effect of COVID -19 shock on the construction industry (this article).
May. Why, and which, construction projects should form a key part of stimulus packages.
June. Investigation into the supply chains that support critical national infrastructure.
July. How cities, towns and infrastructure could be designed for density but not crowding.
August. Which digital practices might stick in design and engineering and their effect on long-term construction operations and productivity.
I’d much prefer to hear from you about which topics to cover. Please contact me.
This first article shares my initial observations written six weeks into the health and economic response to COVID-19. It presents a basic framework for describing the economic shock to the construction industry, and how it might recover.
Why aren’t there any numbers in this analysis?
If you’re comfortable with numbers, it’s tempting to throw some around, but it’s probably not the right approach just yet.
It’s not that there’s a lack of data. Each country, business and household is choosing between health and economy, whether on purpose or not. While these are only in conflict in the short term, the outcomes are described by a new (or perhaps just recently popularised) wave of epidemiological and economic data. The Australian Bureau of Statistics (ABS), researchers and industry groups are doing extra work releasing and interpreting these (ABS, 2020c).
These data however, are being drawn on to make decisions against a level of uncertainty that we’ve not had for a long time, and they are describing variables that we’re not used to incorporating into our decision making. When was the last time you made a decision based on a virus reproduction rate?
We need to get to know the problem and the data better before we start quantifying it. Otherwise we risk having precise, but rubbish models.

Sketch 1: An example of a model that has been making the rounds lately. I don’t think it describes the problem well enough to be useful in decision making.
There’s a book just out, with uncanny timing, from ex-governor of the Bank of England Mervin King and economist John Kay, called Radical Uncertainty that’s worth reading. The Times says it's just an “eloquent rant against the faux precision of mathematical models”, but they do explain why we should use scenarios or ‘narratives’ to explore the options qualitatively, rather than rely on quantitative probabilistic models for these kinds of decisions.
This is ok while things are wild, but qualitative analysis is fraught too. Our own biases will be affecting our judgment until we calm down. If we were to use judgement alone, whose should we follow anyway? The most confident person? The most experienced? Experienced in what?
Rather than write off quantitative analysis all together, I’ll start with qualitative observations and add data over the next few months. If you’d like to contribute, please take this survey.
A framework for describing shock and recovery
I use the sketch below to think about the effect of shock on the construction industry and its ability to recover over time. The vertical axis represents production, which could be measured any number of ways including Gross Domestic Product (GDP), or GDP growth, or total value of construction projects in a state or nation.
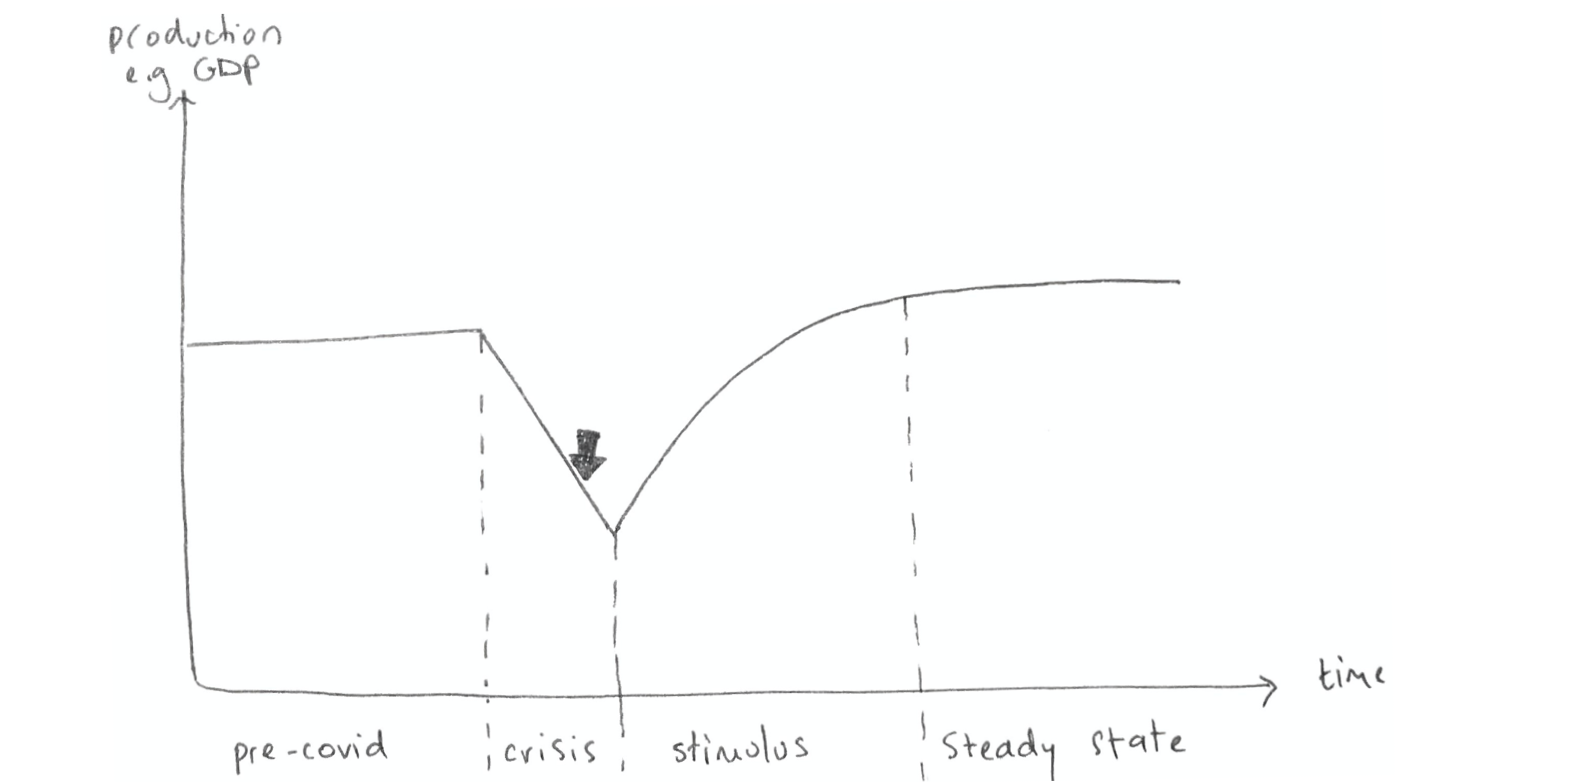
Sketch 2: Shape of crisis and recovery
Economists loosely refer to the shape of recovery with letters. Most desirable is a V, which is a short and sharp dip. Then comes U, which has less of an initial shock, and is more sustained. A double dip, or W is where the economy rebounds and then tanks again. Worst, and what we don’t want, is an L, which dips and never really recovers.
The International Monetary Fund (IMF) is forecasting that Australia will have a V shaped recession, losing 6.7% of GDP in 2020, followed by a 6.1% gain in 2021 (IMF, 2020). It's an enormous dip compared with other recessions (Hawkins, 2020), but it’s weirdly good news because it’s short and sharp. Not everyone agrees. Some suggest that it's overly optimistic because Australia is too dependent on trade, tourism, migrants and foreign students (ABC, 2020a). Others warn that unemployment won’t recover so quickly.
I don’t know which shape we will take. I’ve chosen a V because it’s nice to be optimistic. It will be influenced by the success of our public health response as we reopen. If we have a second or third wave of infections, or if we don't plan stimulus well, we may see a pulsed line. There are not enough countries balancing reopening and infection yet to hint to what recovery could look like, but there will be plenty soon.
I think we’re somewhere in the crisis stage still, perhaps around the black arrow. I initially thought this crisis period would be about six months, but our recent success in suppressing infection has already seen some states cautiously relax some rules. We also seem to have avoided a financial crisis, maybe because we already addressed underlying problems back in the years following the GFC. Perhaps this crisis period is more like three months. Perhaps that’s wishful thinking.
What do you mean by ‘construction’ in Australia?
The construction sector services almost every other sector. This breadth makes it interesting, but it also makes analysing and forecasting construction activity difficult. In order to understand construction, we must understand every sector that it serves.
I look at it as a system of nodes and wires. Nodes are the buildings and precincts we visit (workplace, school, hospital). Wires are the infrastructure in the background that we barely notice unless it’s done badly or missing (transport, water, energy). Both nodes and wires can be publicly or privately funded. The sketch below shows subcategories of nodes and wires, which I’ve adopted from ABS quarterly construction activity reports.
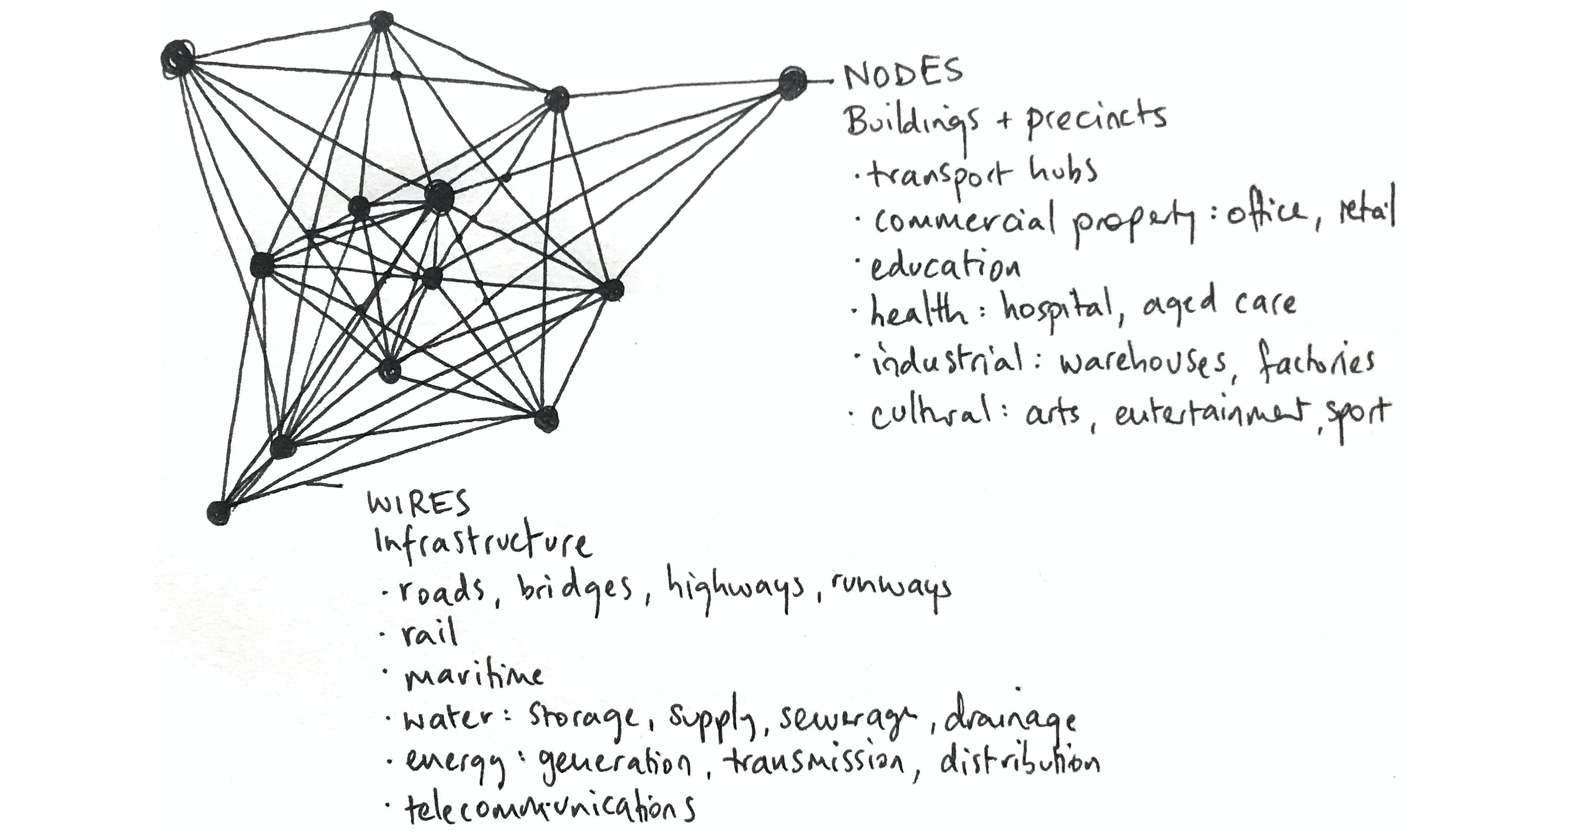
Sketch 3: Buildings, precincts and infrastructure
There are big gaps above: residential, heavy industry, agriculture and defence. I don’t know enough about these to include them in my commentary.
Observations on the Australian construction market, six weeks in
It’s been clear for a few weeks that the fraught decision is not to lock down, but to open up. Open up too soon and we risk our health and a second economic shock. Open up too late, and many businesses won’t make it.
If we return to the shock and recovery sketch, we can make some observations on three variables that describe the shape: the depth of the initial shock, the recovery time, and the level of production we return to afterward.
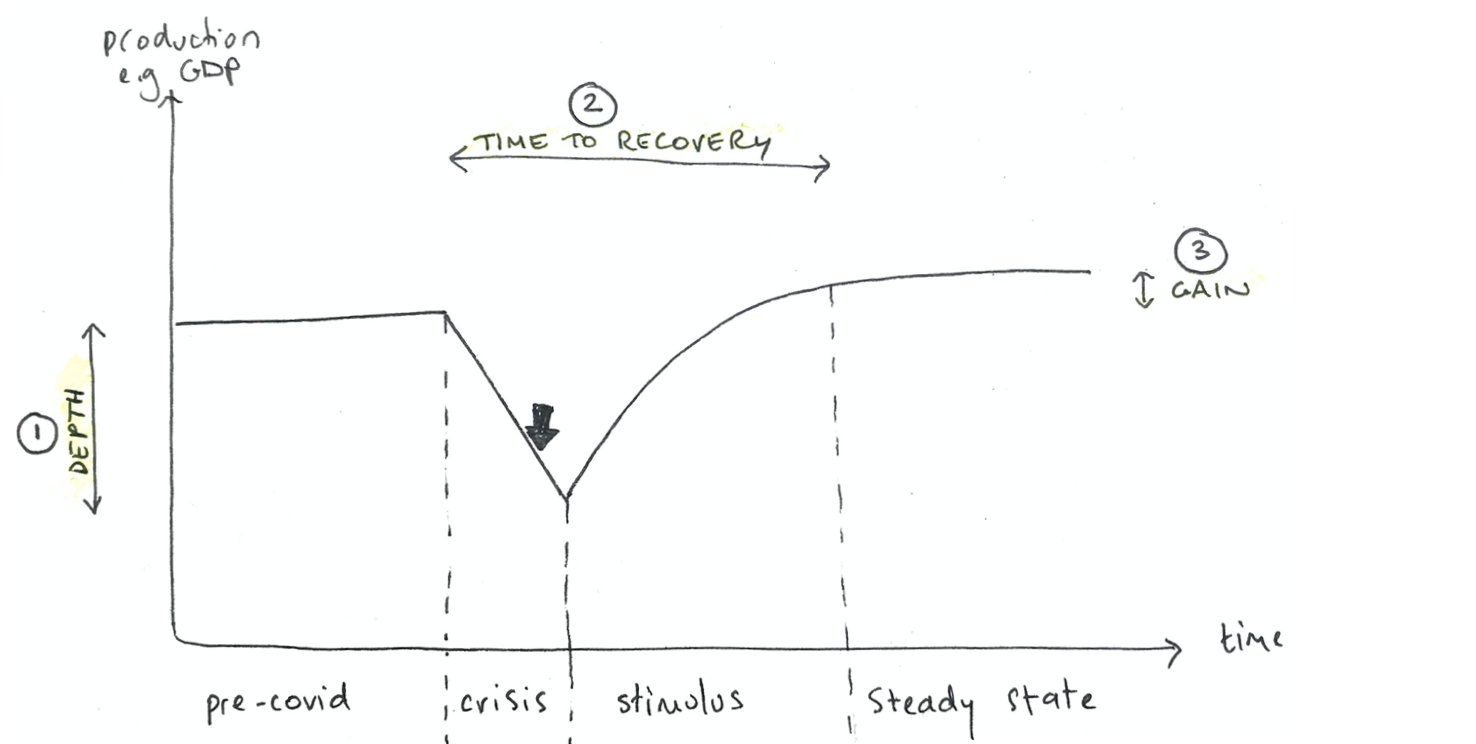
Sketch 4: Three variables in crisis recovery
Variable 1: Shock Depth
The construction sector has suffered a shallower shock so far than many others. I think this is for three reasons. First, construction escaped the most severe lock-down restrictions, and most construction businesses are still operating (ABS, 2020a). Second, construction sector workers either can implement social distancing (O*NET, 2020) or can work from home more easily than other sectors. The Grattan Institute estimates employment shock for construction to be lower than most other sectors (Grattan Institute, 2020). Third, construction projects have long lead times – months and years. Save some projects that were cancelled immediately (mostly in education and commercial property), many projects on the books, in design and site phase, have continued. One could argue that if they’ve survived the last month, they’re unlikely to be cancelled now.
One factor that is difficult to find consensus on is the effect of supply chain on the depth of the shock. I've heard from some that construction material supply is a little bit delayed, but masked by lower productivity from extra safety requirements and distancing on site. I've heard from others that they are experiencing serious delays, and that quality is becoming a key concern due to high demand, and restrictions on physical inspections.
The crisis and recovery curve will look different for each construction sub-sector. Some notes on this:
So far, it seems that the biggest shocks are in consumer facing sectors such as commercial property (office, retail, hotel), education (universities), some transport infrastructure where demand risk has been transferred to the private sector (e.g. toll roads) and of course, cultural sector and tourism.
Developers large and diversified enough have been building buffers (SMH, 2020) to protect their pipelines, presumably betting that despite the uncertainty, they can ride out the shock. This would work better for some asset types than others, such as hotels or build-to-rent, where the long term demand is expected to return after short, sharp shock. Offices and retail may not return so quickly. For example, developers are reluctant to invest in office and retail spaces without anchor tenants. Many companies, the would-be anchor tenants, are reconsidering their planned office relocations given the increased number of people likely to work from home, even after the pandemic is over.
Universities, which had big pipelines of major capital works before March, are unable to invest in campus development without the prospect of international students returning. Many universities have delayed those projects, such as ANU’s SA8 precinct (Canberra Times, 2020), presumably until they can secure government stimulus, re-open to international students (obviously difficult with closed borders), or develop new revenue streams. An interesting example of this is Monash University’s recent deal in China (Financial Times, 2020).
This contraction may be offset by growth in other sub-sectors, such as industrial (warehousing, factories), health, resources and areas targeted by stimulus packages. These could be rail, roads, energy, water and social housing (through built-to-rent).
Variable 2: Recovery Time
The construction sector could experience, and contribute to, a ‘V’ shaped recovery. Most governments are holding to their civil infrastructure plans, recognising them as critical in recovery. Word is that Ministers are being asked to find and fast-track projects. Construction is seen as a lever in stimulus responses, perhaps because it represents the largest number of businesses (almost 17%) in the Australian economy (ABS 2020b) and a large proportion of employees. The Federal Government strategy appears to be focused on stimulating the economy through business.
Add to this, the construction sector is more flexible than most. When university, cultural and aviation sectors suffer instant and crippling contraction in customers, investment and asset development, the industry can pivot to other sectors that are seeing funds and appetite swing their way. Many organisations – private and public – have already responded by dusting off shovel-ready projects prepared for the GFC twelve years earlier.
There is one point of concern. The lag in projects described earlier, means that the construction sector is less affected than some sectors right now, but could struggle in a few months, once these existing projects pass. Without a targeted and sustained stimulus, we could see a W-shaped recession as construction replaces hospitality and tourism as a problem sector.
Governments have been focusing media announcements on survival spending rather than stimulus spending so far, but they are working on stimulus plans behind the scenes given the lag time for design, documentation, tendering, approvals and starting construction on major projects. The Federal Government set up the National COVID-19 Coordination Commission to focus on economic and social recovery. They have talked about a $2Bn liquid ammonia plant (Daily Telegraph, 2020), but there’s not much public information about the rest of their project list yet. Watch this space.
Variable 3: Production Gain
Australia has had poor productivity in construction over the last few years (AFR, 2019). It is difficult to assess whether changes arising from COVID-19 will improve this in the long run. It is far away, and we need to navigate the health and economic crises first.
There are two factors that may improve productivity that I’ll be tracking in the meantime. First, is whether we start to see the benefits of forced digital transformation, with a raft of digital methods for infrastructure design, construction, operations and maintenance, previously only used in pilot projects, being adopted at scale.
Second, is whether we see higher productivity per hours worked as our workforce continues to deliver the same amount but on fewer days. This will be difficult to maintain if the pipeline does pick up, because there will be skills shortages as fewer skilled migrants and temporary visa holders can enter Australia, a key part of the construction and design workforce.
We should also be learning our lessons. I would hope to see more emphasis on the role of infrastructure in building Australia’s resilience to further disruption in supply chains from crises including pandemics, geo-political instability and climate change. The Department of Defence looked into Australia’s resilience to supply chain disruption last year. As far as infrastructure goes, they found weaknesses in water treatment (chemicals sourced overseas), fuel supply, civil construction supplies, electricity and communications supply (ABC, 2020b).
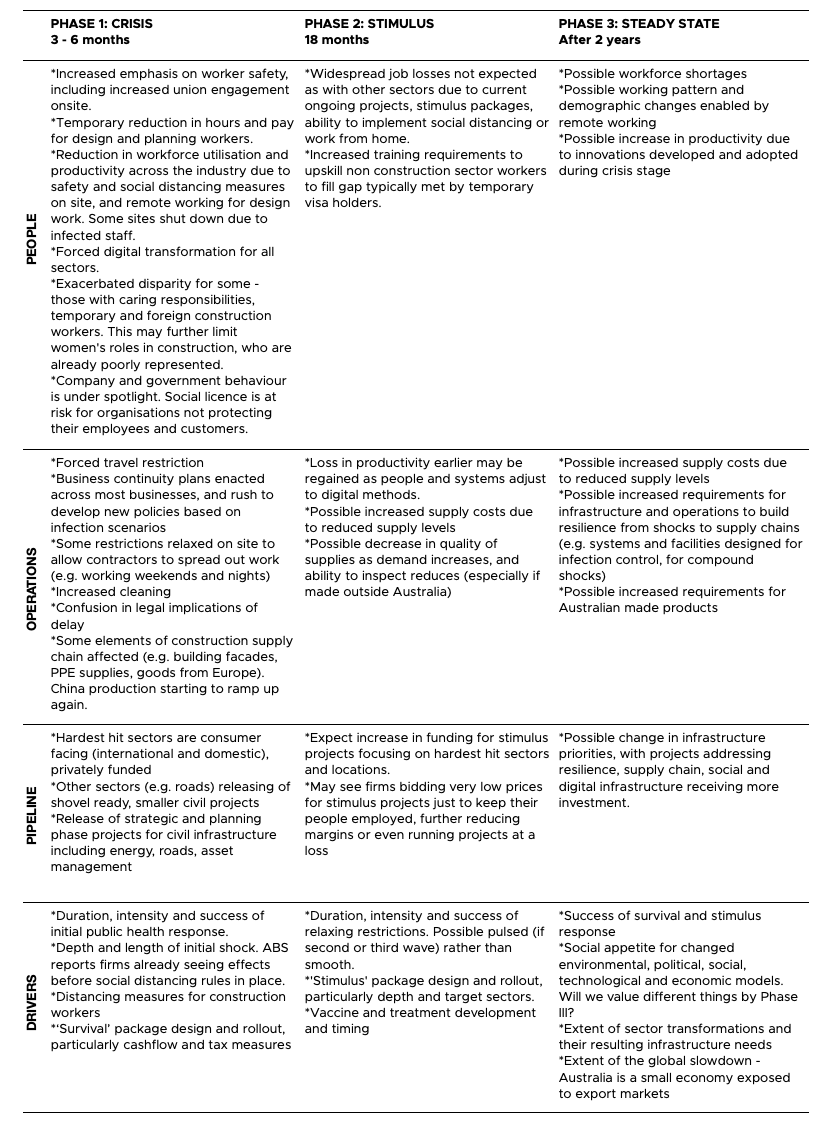
All the notes above are summarised in the table below.
What next?
I’ll look in detail at some of the more interesting topics that I brushed over in this article, starting with stimulus spending and then supply chains. I’d prefer to be guided by your interests, so please contact me with suggestions. The analysis will be much more interesting with your input - please take this survey. Thirty responses would be good enough.
Until then, stay healthy and enjoy the possibility of growing freedoms.
Acknowledgements
Thank you to all the people who took time to speak with me about the industry over the last two months. Thank you also to the Australian Construction Industry Forum (ACIF), which provides helpful reports, insight and advocacy for the industry. I’m a member of their forecasting council.
References
ABC. 2020a. “Think of Coronavirus as a Test Run: Australian Military Leaders Warn We Must Prepare for Worse.”
——— 2020b. “Coronavirus recession will change economy forever, warns ANZ CEO Shayne Elliott”
ABS. 2020a. “5676.0 Trading Status of Australian Businesses.”
——— 2020b. “8165.0 Counts of Australian Businesses.”
——— 2020c. “COVID-19: Additional Products to Measure the Impact.”
AFR. 2019. “Construction the Drag on Productivity.”
Grattan Institute. 2020. “Shutdown: Estimating the COVID-19 Employment Shock.”
Hawkins, J. 2020. “How Will the Coronavirus Recession Compare with the Worst in Australia’s History?” The Conversation.
IMF. 2020. “World Economic Outlook, April 2020 -- Chapter 1: The Great Lockdown.”
O*NET. 2020. “Work Context: Physical Proximity.” 2020.
SMH. 2020. “Diversified developer Lendlease taps investors for $1.15b”
The Canberra Times. 2020. "ANU cutting costs as massive coronavirus hit looms”
The Daily Telegraph. 2020. "National COVID-19 Co-ordination Commission boss Nev Power supports Perdaman ammonia plant”
The Financial Times. 2020. "Australian university signs A$100m China deal despite concerns”